| PARAMETER |
STATION 1 |
STATION 2 |
STATION 3 |
STATION 4 |
STATION 5 |
STATION 6 |
STATION A |
STATION B |
| Date & Time |
2013-04-20_14:09:06 |
2013-04-18_21:25:29 |
2013-04-00_00:00:00 |
2013-04-20_14:03:31 |
2013-04-00_00:00:00 |
2013-04-00_00:00:00 |
2013-04-20_13:46:12 |
2013-04-20_13:46:59 |
| Solar cell (%) |
N/A |
13.48 |
0.00 |
84.08 |
0 |
0 |
N/A |
N/A |
| Batterry (%) |
N/A |
85.94 |
0.00 |
69.82 |
0 |
0 |
N/A |
N/A |
| Air humidity (%) |
N/A |
66.03 |
, 0 |
50.45 |
0, |
|
87.20 |
73.95 |
| Air temperature |
N/A |
24.01 |
0, |
34.98 |
89, |
|
17.26 |
19.09 |
| Soil humidity (50 cm) (V) |
N/A |
2.19 |
0.00 |
N/A |
0.00 |
0 |
N/A |
N/A |
| Soil humidity (100 cm) (V) |
N/A |
0.24 |
0 |
N/A |
0 |
0 |
N/A |
N/A |
| Soil temperature (V) |
N/A |
N/A |
0 |
N/A |
0 |
0 |
N/A |
N/A |
| Wind direction |
N/A |
69, |
N/A |
632 |
…Y\+ |
N/A |
N/A |
N/A |
| Wind speed |
N/A |
N/A |
N/A |
N/A |
N/A |
N/A |
N/A |
N/A |
| Rain value |
N/A |
N/A |
N/A |
N/A |
N/A |
N/A |
N/A |
N/A |
| OUT-ZONE SOIL ( ONLY SOIL HUMIDITY SENSOR) |
| PARAMETER |
STATION 1 |
STATION 2 |
STATION 3 |
STATION 4 |
STATION 5 |
STATION 6 |
STATION A |
STATION B |
| Soil humidity (50 cm) (V) |
N/A |
1.84 |
N/A |
N/A |
N/A |
N/A |
N/A |
N/A |
| Soil humidity (100 cm) (V) |
N/A |
0.60 |
N/A |
N/A |
N/A |
N/A |
N/A |
N/A |
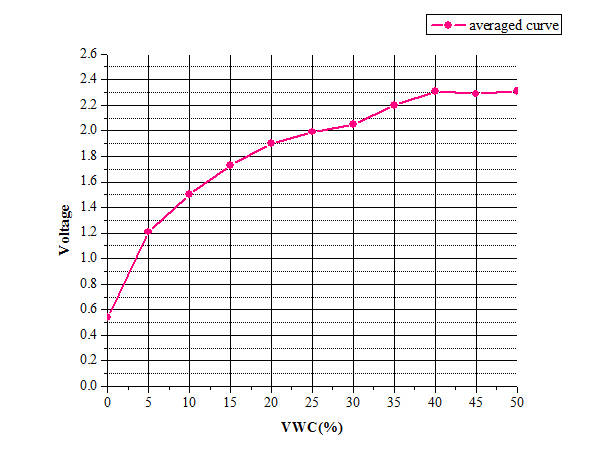
| Experimental data of soil from granmonte (Voltage vs Volumetric Water Content) |
| Vegetronix soil humidity sensor |
VWC (%) |
Centibar |
Davis soil humidity sensor |
 |
0 |
200 |
|
5 |
200 |
10 |
200 |
15 |
93 |
20 |
82 |
25 |
69 |
30 |
52 |
35 |
20 |
40 |
9 |
45 |
4 |
| |
50 |
1 |
|
(c) Copyright 2012 Mahidol University |
|
|